Market Info

Who bought real estate in 2021 in Marbella & Benahavís?

Although when working on real estate at the Costa del Sol we have a rough idea of the nationalities that are buying more properties, it is always interesting to see what the actual numbers show based on the data published by the Association of Land Registrars.

GRÁFICO 2 - NÚMERO DE VIVIENDAS VENDIDAS EN BEHAHAVÍS 2º TRIMESTRE 2021

As shown on chart 1, the percentage of foreigners buying on the Costa del Sol has practically not changed since 2018. The number of sales is much higher than the one of 2020 but similar to the numbers closed between 2016 and 2018.

Regarding the nationalities and chart 2, it can be seen that the British are still the nationality that buys more properties in Andalucia but with a clear decline after the Brexit vote in 2016. Second and third on that ranking appear Swedish and Belgium buyers. To be noted is also the decline of the sales to French and to Russians who have almost a neglectable percentage coming from a fourth place in 2013. Although it is not on the chart, the percentages for the province of Malaga follow the same pattern with Bristish, Swedish and Belgiums as the nationalities buying more in the area.
¿Quiénes han comprado en Marbella y Benahavís en 2021?

Aunque trabajando en el sector inmobiliario en la Costa del Sol siempre tenemos una percepción de las nacionalidades que más propiedades están comprando, es interesante ver lo que muestran las cifras reales en base a los datos publicados por el Colegio de Registradores de la Propiedad.

GRÁFICO 2 - NÚMERO DE VIVIENDAS VENDIDAS EN BEHAHAVÍS 2º TRIMESTRE 2021

Como primera aproximación y como se muestra en el gráfico 1, el porcentaje de extranjeros que compran en la Costa del Sol no ha variado prácticamente desde 2018. En cuanto al número de ventas se ve que es muy superior al de 2020 pero similar a las cifras cerradas entre 2016 y 2018.

En cuanto a las nacionalidades con referencia al gráfico 2, se observa que los británicos siguen siendo la nacionalidad que más propiedades compra en Andalucía pero con un claro descenso tras la votación del Brexit en 2016. En segundo y tercer lugar de ese ranking aparecen suecos y belgas. A destacar también el descenso de las ventas a franceses y a rusos que tienen un porcentaje casi despreciable viniendo de un cuarto puesto en 2013. Aunque no aparece en el gráfico, los porcentajes de la provincia de Málaga siguen el mismo patrón con británicos, suecos y belgas como las nacionalidades que más compran en la zona.

2021, récord year for closed transactions in Marbella and Benahavís

Great surprise to see the numbers published recently by the Ministry of Housing on the numbers of closed transactions at the fourth quarter of 2021 for the municipalities of the Costa del Sol. The sale numbers are even better than expected. We knew that the fourth quarter of last year had been a good one but we were not expecting to reach those levels that are, in some cases, higher than the ones of the years before the 2008 crisis. In fact, in Marbella, Benahavís, Estepona and Mijas, this last quarter of 2021 has been the best in the number of closed sales in the history of those municipalities.

GRÁFICO 2 - NÚMERO DE VIVIENDAS VENDIDAS EN BEHAHAVÍS 2º TRIMESTRE 2021

When looking at Chart 1 with the closed transactions per year, it shows that 2021 has been the best year after 2008. The tendency was showing a decline since 2017 but 2021 broke that downward tendency. A lot was said about a post pandemic recovery taking into account that people preferred to spend the time confined in a nice home in Marbella enjoying our weather than in some other places of Europe and that it is perfectly possible to work remotely for business owners while living at the coast. However, the rebound has been unexpectedly high.

If a look is taken to the data of Benahavís shown on Chart 2, it can be seen that the numbers are amazing and that 2021 has been, with a difference of a +15%, the best year ever in the history of Benahavís when considering the number of closed transactions. That number comes from an incredible number of closed sales in the fourth quarter that has been an amazing 28% higher than the previous record year, 2014.

Although the charts for Estepona and Mijas have not been included, they show for Estepona, as in Benahavís, historical records and, for Mijas, the best year since 2008.

Having this spectacular numbers brings the next question that is for how long the market will maintain this level of activity. The best answer is who knows but we would really like to know it. In general, the predictions state that the stress on the economy caused by energy prices may continue to the summer and then will relax. That also will affect the inflation in Spain that is expected to be on 7,5%, too high for this year and not sustainable, but with a prediction to go down to at least 4% next year. That will also push the interest rates up which is not good for the sales but does not affect that much, if they stay on normal levels, to holiday homes. Therefore, although the economy in general may be stressed at least in the short term, the conditions that caused the level of sales we are having are still there so, and this a general comment I am hearing in the market, everybody expects at least another two years of high activity. Time will tell.

2021, año récord en la venta de viviendas en Marbella y Benahavís

Ha sido una gran sorpresa ver los números publicados recientemente por el Ministerio de Fomento sobre el número de transacciones cerradas en el cuarto trimestre de 2021 para los municipios de la Costa del Sol ya que son incluso mejores de lo esperado. Sabíamos que el cuarto trimestre del año pasado había sido bueno pero no esperábamos llegar a esos niveles que son, en algunos casos, superiores a los de los años anteriores a la crisis de 2008. De hecho, en Marbella, Benahavís, Estepona y Mijas, este último trimestre de 2021 ha sido el mejor en número de ventas cerradas de la historia de esos municipios.

GRÁFICO 2 - NÚMERO DE VIVIENDAS VENDIDAS EN BEHAHAVÍS 2º TRIMESTRE 2021

Si se observa el Gráfico 1 para Marbella, se puede ver que 2021 ha sido el mejor año desde 2008 y aunque la gráfica muestran un descenso desde 2017, 2021 rompió esa tendencia a la baja. Se ha hablado mucho de una recuperación post pandemia teniendo en cuenta que la gente prefería pasar el tiempo confirmada en una buena casa en Marbella disfrutando de nuestro clima que en otros lugares de Europa y que, para los empresarios, es perfectamente posible trabajar a distancia mientras viven en la costa. Sin embargo, dicho repunte ha sido inesperadamente alto.

Por otra parte, y mirando a los datos de Benahavís que se muestran en el Gráfico 2, se puede ver que los números son espectaculares y que 2021 ha sido, con una diferencia de un +15%, el mejor año de la historia de Benahavís si se considera el número de transacciones cerradas. Esa cifra proviene de una cifra record de ventas en el cuarto trimestre que ha sido un 28% mayor que el anterior año récord, 2014.

Aunque no se han incluido los gráficos de Estepona y Mijas, los datos muestran para Estepona, al igual que en Benahavís, récords históricos y, para Mijas, el mejor año desde 2008.

Al observar estos números siempre surge la pregunta de por cuánto tiempo el mercado mantendrá este nivel de actividad. La mejor respuesta es no se sabe, aunque nos gustaría saberlo. En general, las predicciones dicen que la actual tensión en la economía causada por los precios de la energía puede continuar hasta el verano y luego se debería relajar. Esto también afectará a la inflación en España, que se espera que se quede este año en el 7,5%, demasiado alta y no sostenible, pero con la previsión de bajar por debajo del 4% el próximo año. Eso también hará que los tipos de interés suban, lo que no es bueno para las ventas, aunque no afecte tanto, si se mantienen en niveles normales, a la compra de viviendas vacacionales. Por lo tanto, aunque la economía pueda estar un poco tensionada, al menos a corto plazo, las condiciones que originaron el nivel de ventas que estamos teniendo siguen ahí, así que, y esto es lo que se comenta en el mercado, todo el mundo espera al menos otros dos años de alta actividad. El tiempo lo dirá.

Property prices go up in Marbella and Benahavís

With the number of transactions we are having and with the inventory going down, prices were bound to go up following the general rule that more demand and less offer leads to higher prices. That is exactly what is happening in the market of Marbella and Benahavis, prices are going up and this can be seen on the charts. There are two lines for Benahavis (Chart 2): The price per square meter published by the real estate portal Idealista that can be identified as “for sale” or “asking” price (green) and the price per square meter obtained form the Land Registry that can be identified as “sold” or “closed” price (blue).

Additionally, in the chart for Marbella (Chart 1), there is a third line that is the average price per square meter obtained from official valuations, published by the Ministry of Housing (red).

GRÁFICO 2 - NÚMERO DE VIVIENDAS VENDIDAS EN BEHAHAVÍS 2º TRIMESTRE 2021

Regarding Marbella, it can be seen that the asking price is sky-rocketing, with owners asking more and more for their homes, while closing prices are also going up, already 13,6% in the last year, but with a “softer” increase. There was a moderation on the tendency in 2020 but the increase is starting to accelerate again. In any case, it will be seen, with the detail in Benahavis, that most of these increases are driven by the selling prices of new built homes. A final comment on the valuation prices of Marbella that are always below the closing prices and, in a similar way, following an upward tendency.

The prices in Benahavis are also following the same path, in this case reaching an extreme increase in closing prices of 18,3% in one year. This can be seen as good for now but I think it is too much for the future. The market will not withstand yearly increases of 18% and it can destabilize it if it keeps on growing at that pace.

Finally, just a comment on the increase of the prices, as mentioned above, driven by new built units. Chart 3 shows the closing prices of second hand homes versus new builds, highlighting that prices of new builds are increasing rapidly while prices of second hand units started to show increases in 2021 but at a slower pace than the new builds. Most of the demand is for new designs and there is also less inventory so prices are pushed up while there is less demand for second hand properties and more stock available so for the moment prices of second hand homes are not increasing as much.

Los precios de la vivienda al alza en Marbella y Benahavís

Estaba claro que con el número de transacciones inmobiliarias que esta habiendo y con la reducción en el número de viviendas en venta, los precios iban a subir siguiendo la regla general del mercado, más demanda y menos oferta. Y esto es exactamente lo que esta pasando en el mercado inmobiliario de Marbella y Benahavís tal y como se puede ver en los gráficos de más abajo. En ellos se ven dos dos curvas para Benahavís (Gráfico 2): el precio por metro cuadrado publicado por el portal Idealista que se puede identificar como precio de propiedades “en venta” (en verde) y el precio por metro cuadrado obtenido del Registro de la Propiedad que se puede identificar como precio de “vendido” (en azul). Adicionalmente, en el gráfico de Marbella (Gráfico 1) aparece una tercera curva con el precio por metro cuadrado obtenido de tasaciones oficiales y publicado por el Ministerio de Fomento (en rojo).

GRÁFICO 2 - NÚMERO DE VIVIENDAS VENDIDAS EN BEHAHAVÍS 2º TRIMESTRE 2021

Si se fija la atención en Marbella, se puede ver que el precio de “en venta” o de salida esta disparado con los propietarios pidiendo cada día más por sus propiedades mientras que los precios de venta reales también están subiendo de forma importante, un 13,6%, pero no tanto como los anteriores. Hubo una moderación en la tendencia en 2020 con la pandemia pero los incrementos están de vuelta. En cualquier caso, y como se mostrará para Benahavís, la mayoría de esta subida esta impulsada por los precios de venta de las viviendas de obra nueva. Respecto a los precios basados en las tasaciones, solo cabe decir que siguen más o menos la misma tendencia de los precios de venta y también al alza.

Los precios en Benahavís también están siguiendo el mismo camino que, en este caso, está alcanzando un aumento de un 18,3% en un año. Porcentaje en principio muy bueno para los vendedores pero que, si siguiera en este ritmo, podría desestabilizar el mercado.

Finalmente, un último comentario sobre los precios reales de venta de viviendas de segunda mano frente a las de obra nueva que se muestran en el Gráfico 3: se puede ver que la subida de los precios esta principalmente impulsada por la subida de los precios de la obra nueva aunque durante 2021 ya se ha empezado a notar la subida de los precios de venta de las unidades de segunda mano. La mayor demanda y el menor stock esta en la obra nueva esta disparando los precios.

El número de viviendas en venta baja en Marbella y Benahavís

Aunque no hay datos oficiales sobre el inventario o número de viviendas en venta se puede hacer una estimación del mismo en base a portales inmobiliarios y bases de datos de viviendas compartidas. No sería el número exacto pero, al menos, puede ofrecer una idea de como es la tendencia.

Inventario Marbella 4T-21.JPG

GRÁFICO 1 - NÚMERO DE VIVIENDAS VENDIDAS EN MARBELLA 2º TRIMESTRE 2021

Esa información sobre el inventario se puede ver en los gráficos 1 y 2 para Marbella y Benahavís. Observando ambos gráficos, la tendencia es clara mostrando una reducción en el número de propiedades en venta en el mercado. Esto está directamente asociado con el aumento en el número de ventas que estamos experimentando. El inventario aumentó a máximos históricos en los últimos años y esto, como se ha ido comentando, estaba afectando en forma de moderación al aumento de los precios. El mercado inmobiliario funciona de la misma manera que otros mercados, más oferta disponible, menos precio.

GRÁFICO 2 - NÚMERO DE VIVIENDAS VENDIDAS EN BEHAHAVÍS 2º TRIMESTRE 2021

Ahora estamos en una situación con más demanda, más ventas y menos número de viviendas en venta que debería hacer subir los precios como ha venido ocurriendo durante 2021. Mirando el detalle, se puede ver que el inventario está bajando en todos los tipos de propiedades y precios, menos el de las villas por encima de 1.500.000 euros. La tendencia que se observa en ese rango es similar en Marbella y Benahavís, esto es, no baja pero se mantiene estable.

La conclusión es que el mercado está tendiendo a un mercado de "vendedores" desde un mercado de "compradores" y esa tendencia a ese cambio de mercado se verá reforzada si la actividad y los números siguen yendo por el mismo camino, más transacciones y menos número de viviendas en venta. El gráfico de la tasa de absorción, es decir el número de meses para vender el inventario completo, que se muestra a a la izquierda como Gráfico 3, muestra una tendencia a la baja indicando que es más fácil vender ahora que hace un año.

Less homes for sale in Marbella and Benahavís

Although there are no official numbers confirming the market inventory - that is the number of homes for sale - it is possible to make an estimation based on information found in real estate portals and property databases. This at least gives us an idea of what the tendency is.

GRÁFICO 1 - NÚMERO DE VIVIENDAS VENDIDAS EN MARBELLA 2º TRIMESTRE 2021

and Benahavís is shown on Charts 1 and 2. Looking at both charts, the tendency is clear. There is a reduction of the number of properties for sale in the market, which is directly associated with the increase of the number of sales we have been experiencing. The inventory reached historical maximums in the last years and as I mentioned before, this affected property prices. The real estate market works in the same way as other markets: more offer available, lower prices. Now we are in a situation with more demand, more sales, and less inventory, which should push up the prices as was the case in 2021.

GRÁFICO 2 - NÚMERO DE VIVIENDAS VENDIDAS EN BEHAHAVÍS 2º TRIMESTRE 2021

Looking at the details, we can see that the inventory is going down for all types of properties and prices apart from villas on sale for more than 1.500.000 euros. The tendency in this range is similar in Marbella and Benahavís, staying stable rather than going down.

The conclusion is that the market is moving from a “buyers´ market” to a “sellers´ market” and this market change will be reinforced if the figures continue going in the same direction, that is more transactions and less inventory.

The chart showing the absorption rate - or the number of months it takes to sell the whole inventory - attached on the left as Chart 3, shows exactly that. A reduction in the number of months to sell the full inventory means that it is easier to sell now than it was a year ago.

Cifras Récord para el sector inmobiliario en la Costa del Sol

La información sobre el número de transacciones cerradas en el tercer trimestre de 2021 para los municipios de la Costa del Sol ha sido publicada recientemente por el Ministerio de Vivienda, mostrando cifras récord para algunos casos y extraordinarias para otros. Para este artículo, he incluido los gráficos de Marbella, Benahavís y Estepona, pero las tendencias del resto de municipios son similares.

Transacciones Marbella 3T 21.JPG

GRÁFICO 1 - NÚMERO DE VIVIENDAS VENDIDAS EN MARBELLA 2º TRIMESTRE 2021

Si nos centramos a Marbella, podemos ver que el tercer trimestre, como preveíamos, ha sido el mejor tercer trimestre en toda la historia de Marbella, superando incluso el récord del tercer trimestre del año 2004. Si el número de transacciones cerradas en el cuarto trimestre alcanza los niveles medios, el año puede ser tan bueno o incluso mejor que los años del último periodo bueno que vimos entre los años 2014 y 2018. En cualquier caso, va a estar por encima de la media de transacciones cerradas en un año para Marbella.

Transacciones Benahavis 3T 21.JPG

GRÁFICO 2 - NÚMERO DE VIVIENDAS VENDIDAS EN BEHAHAVÍS 2º TRIMESTRE 2021

En cuanto a Benahavís, el número de transacciones cerradas en los tres primeros trimestres del año ya están por encima de la media anual del municipio. El número de operaciones cerradas en los tres primeros trimestres es superior al total de operaciones cerradas en 2017, 2019 y, por supuesto, 2020. Hasta el tercer trimestre, solo ha habido un año en la historia mejor que 2021 y fue 2015. Por lo tanto, ya tenemos cifras récord para Benahavís y, dependiendo de las operaciones cerradas durante el cuarto trimestre, podría ser el mejor año hasta ahora.

Transacciones Estepona 3T 21.JPG

Los números de Estepona muestran un panorama similar: ha sido el mejor tercer trimestre de la historia inmobiliaria de Estepona y hasta el tercer trimestre de 2021, el mejor año de la historia en número de operaciones cerradas, superando el máximo histórico de 2017.

Viendo estas cifras somos bastante positivos de cara a 2022. Esperamos que las nuevas oleadas de covid-19, similares a la que estamos afrontando ahora, no afecten negativamente al mercado inmobiliario de la Costa del Sol sino que tengan, incluso, un impacto positivo.

Record numbers for Real Estate on the Costa del Sol

The information on the number of transactions closed in the third quarter of 2021 for the municipalities of the Costa del Sol has been released recently by the Ministry of Housing, showing record numbers in some cases and outstanding figures in others. For this article, I have included the charts for Marbella, Benahavís and Estepona, but the tendencies for the rest of the municipalities are similar.

Transacciones Marbella 3T 21.JPG

CHART 1 - NUMBER OF HOMES SOLD IN MARBELLA 2nd QUARTER 2021

Focusing on Marbella, we can see that the third quarter, following the activity we had on that quarter, was the best third quarter in the history of Marbella, surpassing even the third quarter of the record year 2004. If the number of closed transactions at the fourth quarter reaches the average levels, the year can be as good or even better than the last series of good years we saw between 2014 and 2018. In any case, it is going to be above the average number of transactions closed in one year for Marbella.

Transacciones Benahavis 3T 21.JPG

CHART 2 - NUMBER OF HOMES SOLD IN BENAHAVIS 2nd QUARTER 2021

Regarding Benahavís, the number of trans-actions closed in the first three quarters of the year are already above the municipality´s yearly average. The number of transactions closed in the first three quarters is higher than the total number of transactions closed in 2017, 2019 and, of course, 2020. Up to the third quarter, there has been only one year in history better than 2021 and that was 2015. Therefore, we already have record numbers for Benahavís and, depending on closed transactions during the fourth quarter, it could be the best year so far.

Transacciones Estepona 3T 21.JPG

The numbers for Estepona paint a similar picture: it was the best third quarter in the history of real estate in Estepona and up to the third quarter of 2021, the best year ever on number of closed transactions, outperforming the record high of 2017.

Looking at these numbers we are quite positive facing 2022. We hope new waves of covid-19, similar to the one we are facing right now, will not affect the real estate market on the Costa Del Sol negatively but have a positive impact.

El Mercado de lujo esta mejor que nunca en Marbella y Benahavís

El mercado inmobiliario de lujo esta viviendo uno de sus mejores momentos en Marbella y Benahavís. Si se observan los números de transacciones cerradas obtenidos del Registro de la Propiedad en los diferentes rangos de precios en los que se ha dividido el mercado de lujo, y teniendo en cuenta que el número de transacciones para 2021 es solo para los primeros seis meses del año, es fácil llegar a esa conclusión. El detalla de esos números por rango de precios se muestra en los gráficos inferiores para Marbella y Benahavís.

GRÁFICO 1 - NÚMERO DE VIVIENDAS VENDIDAS EN MARBELLA 2º TRIMESTRE 2021

Si nos centramos en la información para Marbella, se pueden obtener dos conclusiones principales: la primera, es que el número de transacciones en el mercado de lujo, si el mercado mantiene la misma tendencia para los últimos seis meses de 2021, se va prácticamente a doblar en los rangos más altos de precios y va a superar sin problema el número de operaciones cerradas en el rango entre 1 y 1,5 millones de euros. Y, la segunda, es que el número de transacciones cerradas en el rango de 1,5 a 4 M€ esta prácticamente al mismo nivel que el número de operaciones cerradas entre 1 y 1,5 M€.

GRÁFICO 2 - NÚMERO DE VIVIENDAS VENDIDAS EN BEHAHAVÍS 2º TRIMESTRE 2021

Los que es absolutamente sorprendente son los números de Benahavís donde en los seis primeros meses del año tenemos alrededor de un 30% más de operaciones en el rango entre 1,5 M€ y 4 M€ que en los años anteriores. Esto ya supone el máximo histórico para Benahavís en ese rango de precios, y solo se ha contabilizado la mitad del año. En los otros dos rangos, por encima y por debajo, no se han alcanzado todavía los números del año 2018 completo pero, si la progresión continua en estos últimos seis meses de 2021, se van a alcanzar también los máximos históricos en ambos.

El mercado inmobiliario de lujo en Marbella y Benahavís esta alcanzando máximos este año como un efecto post-pandemia. Marbella es el sitio perfecto para disfrutar al aire libre, especialmente en invierno lo que, a la vez, también dificulta la transmisión del Covid, y esto atrae a millonarios europeos que vienen buscando una mejor calidad de vida.

The home luxury market better than ever in Marbella and Benahavís

The luxury real estate market in Marbella and Benahavís is doing better than ever. Looking at the data of closed transactions for different price ranges in the luxury market segment obtained from the Land Registry, and taking into account that the closed transactions numbers for 2021 are only for the first six months of the year, it is easy to obtain that fast conclusion. The detailed numbers can be found on Chart 1 for Marbella and on Chart 2 for Benahavís.

CHART 1 - NUMBER OF HOMES SOLD IN MARBELLA 2nd QUARTER 2021

Looking at the data for Marbella, you can reach two main conclusions: Firstly, transactions will probably almost double in the high price segment compared to previous years if the market continues at the same pace during the second half of the year and will easily surpass the figures of the last years for properties between 1M€ and 1.5M€. The second conclusion is that the number of transactions closed between 1M€ and 4M€ is almost the same as between 1M€ and 1.5M€, following the trend of 2020.

CHART 2 - NUMBER OF HOMES SOLD IN BENAHAVIS 2nd QUARTER 2021

The figures for Benahavís are truly amazing. In the first six months of 2021 there are already about 30% more closed transactions in the range from 1,5 M€ to 4 M€ than there were in previous years. We have already reached the historical maximum in Benahavís for that range and only half of the year has been accounted for. For the other two ranges, from 1 M€ to 1,5 M€ and 4 M€ upwards, we have not yet reached the number of closed transactions we had in 2018, but if the trend continues, we are also going to see the historical maximum in those two ranges.

The luxury real estate market in Marbella and Benahavis is hitting maximums this year as a post-pandemic effect. Marbella and Benahavis are the perfect places to enjoy life outdoors all year round, which also prevents covid transmission, and that attracts wealthy Europeans looking for a better quality of life.

The real estate market is on the go in Marbella and Benahavis

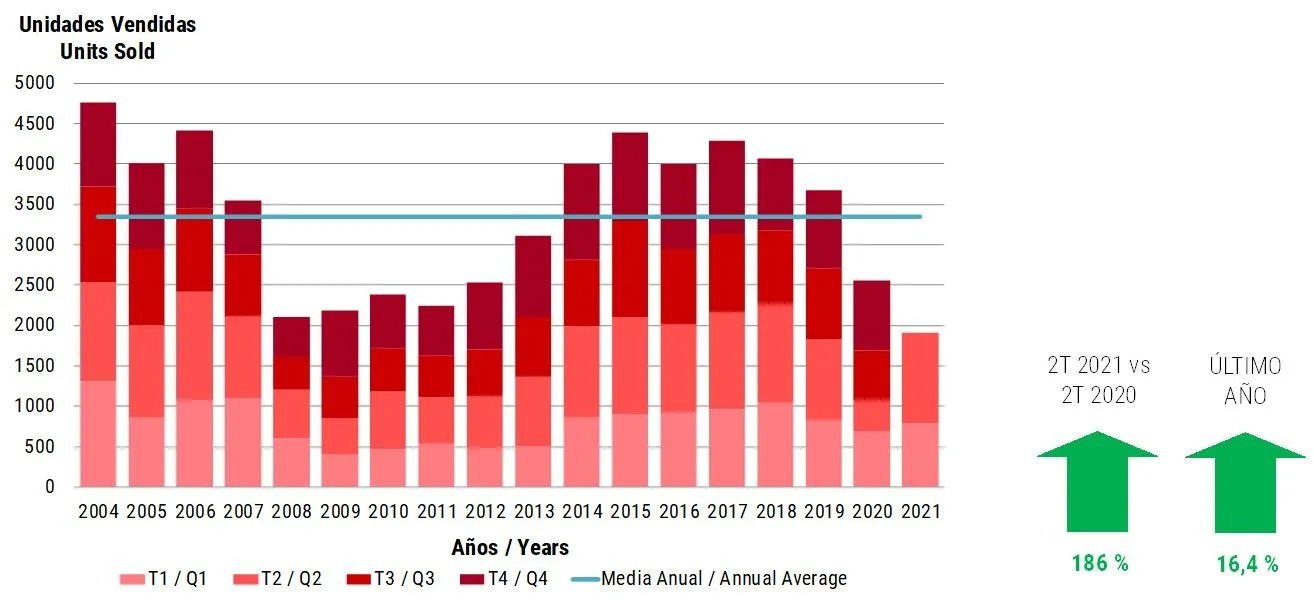
The information on the number of transaction closed in the second quarter of 2021 for Marbella and Benahavis has been recently released by the Ministry of Housing to show what all of us where expecting, extremely good numbers.

Looking at Marbella and the data on Chart 1, it can be seen that, although the number of closed sales has not reached the numbers of the best last years, from 2014 to 2018, it has gone over the number of sales in the first semester of 2019 and it is going to be above the average of the last 17 years. Not to say that if the data is compared with the second quarter of 2020, the quarter of the hard lock down, a 186 % increase is observed. On the field, we noticed some more activity in the third quarter of this year, after the release of travelling restrictions, than even in the second quarter so we expect that the numbers of the year will became even better. The data will be available in December and will be able to confirm that the market is going that line.

CHART 1 - NUMBER OF HOMES SOLD IN MARBELLA 2nd QUARTER 2021

In Benahavis, the numbers are even better as the increase versus the second quarter of 2020 reached 242 % and the year over year 47 %, so better than in Marbella. Observing Chart 2, it can be seen that the number of closed transactions in the first semester of 2021 is the best of the last 17 years and if the number of closed transactions keeps on going with the same tendency, and we noticed more activity in the market in the third quarter when compared to the second quarter, we may be facing the best year ever in the history of the real estate market in Benahavis.

CHART 2 - NUMBER OF HOMES SOLD IN BENAHAVIS 2nd QUARTER 2021

As I commented in my previous Newsletter, prices of second hand properties did not go up, as it happened with the prices of new build units and buying those second hand properties may be the best option in terms of value, even if they have to be refurbished, or even as investments assets before the prices of these second hand residences start to go up now that the market is going with favorable winds.

El Mercado Inmobiliario esta disparado en Marbella y Benahavís

El Ministerio de Fomento acaba de publicar las últimas estadísticas con el número de viviendas vendidas en el segundo trimestre de 2021 en Marbella y Benahavis que confirman lo que todos esperábamos, muy buenos números.

Si se mira a Marbella y los datos que se recogen en el Gráfico 1, se puede observar que, aunque el número de ventas cerradas no ha alcanzado los números de los mejores últimos años, es decir de 2014 a 2018, el número de ventas sobrepasa los datos de ventas del primer semestre de 2019 y esta por encima de la media de los últimos 17 años. Ni que decir tiene que si comparamos las ventas del segundo trimestre del 2020, el del confinamiento más duro, con las del segundo trimestre de 2021 se ve un aumento de 186%. Si nos referimos a las sensaciones en la calle, vimos más actividad en el tercer trimestre que en el segundo y especialmente cuando se levantaron las restricciones a los viajes por lo que esperamos que los números finales del año puedan ser incluso mejores. La información estará disponible en Diciembre y se podrá confirmar si el mercado sigue en esa línea.

GRÁFICO 1 - NÚMERO DE VIVIENDAS VENDIDAS EN MARBELLA 2º TRIMESTRE 2021

Por otra parte y mirando a Benahavís, los números son incluso mejores que los de Marbella con un aumento respecto al segundo trimestre de 2020 de un 242% y un aumento en los últimos doce meses de un 47%. Observando el Gráfico 2 se puede ver que el número de transacciones cerradas en el primer trimestre de 2021 ha sido el mejor de los últimos 17 años y si el número de operaciones cerradas sigue manteniendo la misma tendencia, y hemos notado más actividad en el tercer trimestre que en el segundo, podemos estar ante el mejor año en número de ventas de viviendas de la historia de Benahavís.

GRÁFICO 2 - NÚMERO DE VIVIENDAS VENDIDAS EN BEHAHAVÍS 2º TRIMESTRE 2021

Como he comentado en Newsletters anteriores, los precios de las viviendas de segunda mano no han subido mucho, de hecho casi no han subido, comparados con los precios de las unidades de nueva construcción y ahora mismo representan la mejor opción a la hora de comprar antes de que los precios empiecen a subir también en ese segmento en este mercado que se esta moviendo con viento a favor.

The rise of home prices in Benahavis

The information on the real estate prices has been recently released for the second quarter of 2021 with positive numbers, maybe too much, and in line with the general optimistism and the activity on the market. The rise in the home closing prices, not asking, in Benahavis has been of 8,7 % in this second quarter that added to the increases of previous quarters gives an annual increase of 22,9 % that I hope will moderate with time because it is not healthy for the market a maintained increase on those levels. If we take into account the asking prices for homes as published by the real estate portal Idelista, the tendency is exactly the same with price increases although, in this case, the upward tendency has been more continuous since 2017 and even maintained during 2020. The percentages for the asking price are 1,2 % in the second quarter and 12,1 % in the last twelve months. This tendency can be observed on Chart 1 where both the asking and closing prices are shown with upwards tendencies in the last years.


CHART 1 - ASKING PRICE vs SOLD PRICE

Going deeper with the data, it has also been studied the variation of the closing prices for second hand properties and new built properties. The reality observed after the analysis shows clearly that the sale of new built units is the one pushing up the prices of homes in Benahavis. While the closing price of second hand properties hardly goes up, the price of new builts has gone up 61,4 % during last year.

CHART 2 - SECOND HAND SOLD PRICE vs NEW UNIT SOLD PRICE

Chart 2 shows the complete different tendencies: closing prices of new built units skyrocking and the ones of second hand homes with a slight increase over the years. In fact, that gap in closing prices is too big wide and may deviate part of the market to the purchase of second ahnd units with the idea of refurbishing them to obtain a final product with a final price cheaper than the price of a new unit. I personally hope that we keep on having this upward tendencies but on a more moderate way to be on a more healthy market.

La subida de los precios de la vivienda en Benahavís

Se acaban de publicar los datos de los precios de venta de la vivienda para el segundo trimestre de 2021 y hay que decir que los datos son positivos, quizá demasiado, y en línea con el optimismo general y la actividad del mercado. La subida en el precio que se ha pagado, no el que se pide, por la vivienda en Benahavís en el segundo trimestre de 2021 ha sido del 8,7 % que sumada a las subidas de los trimestres anteriores arrojan una subida en los últimos 12 meses de un 22,9 % que entiendo que se ira moderando con el tiempo porque no es sano una subida de la vivienda de un 22 % anual. Si tenemos en cuenta el precio que se pide por la vivienda, y para ello se toman los datos de portal inmobiliario Idealista, la tendencia es exactamente las misma, de subida de los precios aunque en este caso, la subida ha sido más continua desde 2017 y se mantuvo incluso durante 2020, las subidas son de un 1,2 % en el segundo trimestre y de un 12,1 % en los últimos 12 meses. Esa tendencia se puede observar en el gráfico 1 de la derecha en el que se ve que la tendencia de los precios de salida y la de los precios de cierra es similar, es decir al alza, en los últimos años.

GRÁFICO 1 - PRECIO EN VENTA VS PRECIO VENDIDO

Para ahondar algo más en los datos, se ha estudiado asimismo la variación en los precios de cierre, de unidades vendidas, de viviendas de segunda mano frente al precio de viviendas nuevas. La verdad es que al estudiar esta variación se ve claramente que son las ventas de unidades nuevas las que están tirando de los precios de la vivienda en Benahavís. Mientras que el precio de venta de las viviendas de segunda mano apenas sube, el precio de venta de la obra nueva ha subido un 61,4 % en el último año.

GRÁFICO 2 - PRECIO VENDIDO NUEVO VS SEGUNDA MANO

En el gráfico 2 se pueden ver esas tendencias, muy al alza en el precio de la obra nueva y muy plana en el caso de venta de vivienda de segunda mano. De hecho, creo que la diferencia de precios ahora mismo es demasiado grande y puede hacer que se desvíen las ventas hacia las viviendas de segunda mano ya que ese margen permitiría renovarlas para obtener un producto final a un precio más asequible que la obra nueva. Personalmente espero que se mantengan estas tendencias pero que poco a poco se vayan moderando para entrar en un mercado más sano.


La venta de vivienda de lujo esta disparada en Marbella y Benahavís

Tengo que decir que todavía me sorprende, y solo están disponibles los datos hasta mayo de 2021 y más cuando la actividad en la calle parece haber sido mayor en los meses siguientes, pero la realidad es que la venta de viviendas de lujo, para este artículo se entiende por encima de un millón de euros, esta disparada en Marbella y Benahavís y, especialmente, en esta última localidad. He estado escribiendo últimamente sobre un exceso de inventario en ese sector pero se esta absorbiendo rápidamente gracias a la escalada de ventas en ese rango de precios alto del mercado. En los gráficos inferiores se ha intentado mostrar la tendencia con información para distintos rangos de precios.

EL MERCADO INMOBILIARIO DE LUJO - MARBELLA

EL MERCADO INMOBILIARIO DE LUJO - MARBELLA

Centrándose en Marbella se puede ver que la tendencia en el aumento del porcentaje de ventas de alto nivel respecto al número total de ventas ha ido aumentado desde 2017 pero ha dado un salto importante en 2021 pasando en un año de aproximadamente un 8% de las ventas a un 11%, esto es, un 28% de subida o, si se mira desde 2017, un 59% de subida. Ambos números nada desdeñables.

En Benahavís la situación es similar pero con una tendencia distinta. El porcentaje de ventas de alto nivel respecto al número de ventas totales fue cayendo en 2017, 2018 y 2019 pero se ha disparado en 2020 y 2021 hasta unos porcentajes que se podría decir que no son normales en un mercado estable. Como se ve en la gráfica, en los cinco primeros meses de 2021 se han vendido más viviendas de alto nivel que en todo 2020, 2019, 2018 o 2017. Si se habla en porcentaje, en un solo año se ha doblado prácticamente el número de ventas en esos rangos hasta alcanzar un 20,6% o incluso se ha triplicado comparado con 2019.

EL MERCADO INMOBILIARIO DE LUJO - BENAHAVIS

EL MERCADO INMOBILIARIO DE LUJO - BENAHAVIS

Tratando de entender la causa de este aumento, hemos hablado con empresarios del sector y se comenta que a razón del covid ha habido un cambio de mentalidad en el comprador de alto nivel que ha decidido no esperar a su retiro o a que su vida cambie por una pandemia para disfrutar de todo lo que la Costa del Sol ofrece, que el nivel de calidad de vida de la vivienda que se compra aquí es superior a la de su país de origen para el mismo precio y que el covid ha demostrado que se puede trabajar a distancia sin perder control del negocio.

The luxury real estate market is booming in Marbella and Benahavis

I have to say that still surprises me, and we have only the data up to may 2021 being the latest months the more active, but the truth is that the sale of luxury homes, understanding luxury for properties on top of one million euros, is booming in Marbella and Benahavis especially in this last municipality. I have been writing lately about the excess of product in the high end market but this excess is being absorbed rapidly thanks to the increase of sales of luxury homes. We have tried to show this tendency in the charts attached with information on different price ranges obtained from the Land Registry.

THE LUXURY REAL ESTATE MARKET - MARBELLA

THE LUXURY REAL ESTATE MARKET - MARBELLA

Focusing on Marbella, it can be seen that the tendency in the increase of percentage of sales of high end properties versus the total number of units sold has been increasing since 2017 but it has jumped in just one year going from 8,2% in 2020 to 10,5% in 2021, that is a 28% increase in percentage. Or, counting from 2017, the increase in percentage has been 59%. Both impressive numbers.

If the focus is on Benahavis, the situation is similar but with a different tendency. The percentage of sales on the high end range versus the total of units sold has been going down in 2017, 2018 and 2019 but it is booming in 2020 and, specially, in 2021 to rates that can not be considered normal in an stable market. As it can be seen on the chart, there are more sales of luxury homes in the first five months of 2021 than in the whole 2020, 2019, 2018 or 2017. When talking about percentages over the total number of sales in Benahavis, the percentage has almost doubled in one year going up to 20,6% o even tripled when compared to the number of 2019.

THE LUXURY REAL ESTATE MARKET - BENAHAVIS

THE LUXURY REAL ESTATE MARKET - BENAHAVIS

Trying to understand the cause of this boom, we have talked to business people on the real estate sector and they commented that, due to covid, there has been a change in the mentality of the high end buyers that have decided not to wait until the retirement or to a change in life due to a pandemic to enjoy all what the Costa del Sol offers, that the level of quality of life the homes they can buy here offer is higher to the ones they can buy at the cities of origin for the same price and that the covid proved that it is possible to work remotely without losing control of the business.

Las ventas se recuperan tras la pandemia en Marbella y Benahavís

Los datos publicados recientemente por el Ministerio de Fomento muestran esa recuperación en las ventas después de un último trimestre de 2020 en el que ya se alcanzaron niveles similares a años anteriores. De hecho, llevamos una línea ascendente en el número de ventas desde que se pudo hacer vida más o menos normal después del duro confinamiento del segundo trimestre de 2020. E, incluso, y esto lo veremos cuando se publiquen los números de ventas del segundo trimestre de 2021 en Septiembre de este año, diría que los números de ventas del segundo trimestre de este año van a ser de los mejores de los últimos años por la actividad que hemos notado en el mercado y las ventas que hemos cerrado. Esa misma sensación es la que transmiten otras agencias inmobiliarias relevantes en la zona de Marbella y Benahavís.

GRÁFICO 1 - NÚMERO DE VIVIENDAS VENDIDAS EN MARBELLA

GRÁFICO 1 - NÚMERO DE VIVIENDAS VENDIDAS EN MARBELLA

Si nos centramos en Marbella y en el gráfico 1, se puede ver que el número de ventas es similar al de 2019 y mayor que el de 2020. También es cierto que es aproximadamente un 12% inferior a la media de los últimos 5 años pero teniendo en cuenta las restricciones a los viajes desde los países origen de los potenciales compradores que teníamos, sigue siendo un número que apuntala la recuperación.

GRÁFICO 2 - NÚMERO DE VIVIENDAS VENDIDAS EN BENAHAVÍS

GRÁFICO 2 - NÚMERO DE VIVIENDAS VENDIDAS EN BENAHAVÍS

En Benahavís ocurre algo parecido pero en este caso con un aumento de un 5% respecto a las ventas que se dieron en 2019 y una recuperación evidente respecto al número de ventas de 2020. Asimismo, en este caso y a diferencia de Marbella, el número de ventas en el primer trimestre de 2021 subió un 20% respecto de la media de los años anteriores a la pandemia lo que ya empezaba a marcar la tendencia al alza del número de ventas que parece que experimentamos en el segundo trimestre.

En general, estamos en un mercado con una tendencia positiva empujado por el aumento en el número de ventas que hará que se absorba el alto inventario que aun tenemos y que ayude a estabilizarlo.

The recovery of the sales after the covid in Marbella and Benahavis

The latest data on prices recently published for the first quarter of 2021 by the Ministry of Housing (Fomento) confirms the recovery on the number of homes sold after a fourth quarter of 2020 when the sales had already reached the levels of previous years. In fact, the number of sales started to show a recovery tendency from the moment we had a more or less normal life after the hard confinement of the second quarter of 2020. Furthermore, and we will see this when the number of sales for the second quarter of 2021 are published in September, I would say that the number of sales of this second quarter could be the best of the latest years taking into account the activity we saw in the market and the sales our team has closed. I have the same feedback from another relevant agencies in the market.

CHART 1 - NUMBER OF HOMES SOLD IN MARBELLA

CHART 1 - NUMBER OF HOMES SOLD IN MARBELLA

If we focus in Marbella and chart 1, it can be seen that the number of sales is this first quarter of 2021 is similar to the number of closings in the first quarter of 2019 and higher than the closings in 2020. It is also true that it is about 12% lower than the average of the last five years but taking into account the restrictions still in place to traveling from the countries origin of the potential buyers, it is a number that confirms the recovery in the sales.

CHART 2 - NUMBER OF HOMES SOLD IN BENAHAVIS

CHART 2 - NUMBER OF HOMES SOLD IN BENAHAVIS

In Benahavis the situation is similar but with an increase of about 5% in the number of sales when compared with the numbers of 2019 and a more than evident recovery versus the numbers of 2020. Additionally, and here the number is different than the one of Marbella, the number of sales of this first quarter of 2021 is about 20% higher than the average of the last five years which is a remarkable number that confirms the recovery in the number of sales.

In general, we are in a market with an upward tendency pushed by the number of closed sales that will help to absorb the high inventory we can still see and to stabilize it.